
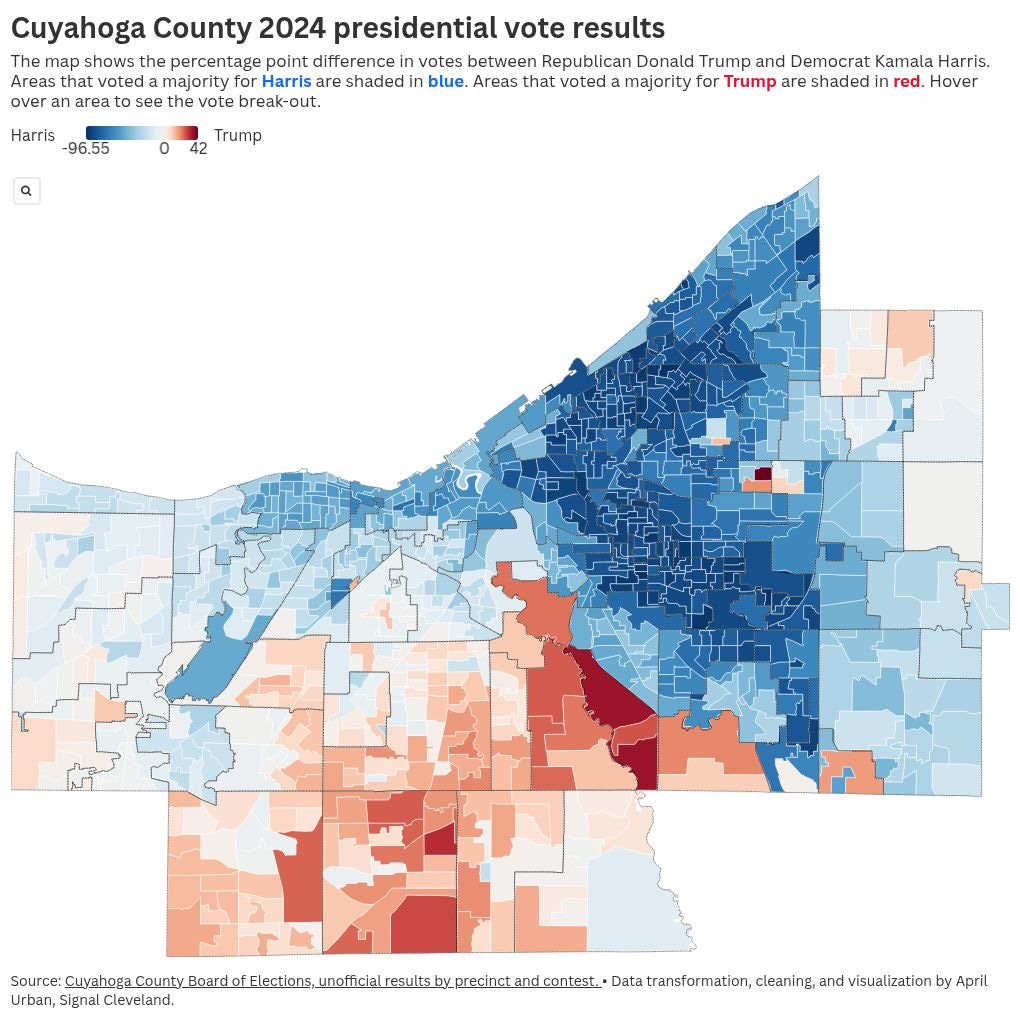
Did the CCDP Money Move the Needle?
Spending More, Gaining Less?

When a new chair took over the Cuyahoga County Democratic Party in 2022, I was waiting to find out something simple: has the party become more financially stable, and is the money being spent translating into measurable gains?
So I went back to the filings. I pulled the numbers from 2021 forward and mapped the balance on hand through every reporting period.
Here’s what the reserves looked like.
2021
Pre-Primary: $176,574
Post-Primary: $141,181
Post-General: $163,037
2022
Pre-Primary: $240,586
Post-Primary: $236,422
Post-General: $241,574
2023
Pre-Primary: $190,936
Pre-General: $176,260
Post-General: $130,914
2024
Pre-Primary: $195,190
Post-Primary: $149,275
Post-General: $202,497
2025
Pre-Primary: $127,543
Post-Primary: $85,245
2026
Start of Year: $164,000
That last number matters. The party is starting 2026 with about $164,000 in the bank. But $107,000 of that came from one candidate transfer. Without it, the party would have entered 2026 closer to $57,000.
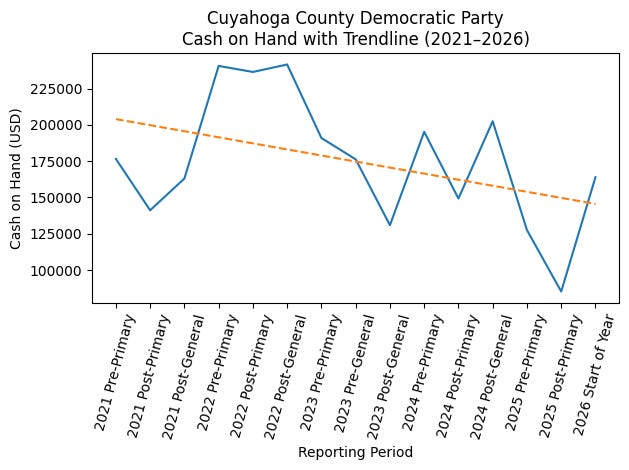
Financially, 2022 was the peak. The party carried more than $240,000 through that cycle. Since then, we’ve seen contraction during off-years and rebounds tied to election timing.
By mid-2025, reserves fell to $85,245. That is the lowest point in five years.
The 2026 rebound is transfer-driven.
If financial stability depends on candidate leftovers, that is not structural strength. That is volatility.
The Low-Hanging Fruit Era
There were real improvements after 2022.
Several city Democratic clubs that had drifted into dormancy were reactivated. Meetings resumed. Leadership turnover brought in new energy. Communication between ward clubs, central committee members, and county leadership improved. Basic coordination that had previously been inconsistent became more standardized.
Political infrastructure does not run on autopilot. When local organizations stop meeting, stop recruiting, stop organizing, turnout suffers. When those organizations wake back up, you see immediate marginal gains. More door knocking. More candidate forums. More sample ballot distribution. More voter contact in targeted precincts.
When local activists reengage, turnout improves at the margins.
But that is the easy lift.
Reactivating something that was underperforming creates a natural rebound. You fix what was broken. You energize volunteers who were previously sidelined. You streamline communication that had deteriorated.
The first phase of improvement is often structural repair.
The second phase requires strategic innovation.
Once the obvious fixes are made, performance plateaus unless strategy evolves. The enthusiasm bump fades. The novelty of new leadership settles into routine. The baseline stabilizes.
That is where many organizations stall.
The question now is whether we are on that plateau.
Are we simply maintaining improved infrastructure? Or are we expanding beyond it?
Are we reaching new voters? Or just better organizing the same base?
Are we building sustainable fundraising pipelines? Or relying on election-cycle injections and candidate transfers?
Low-hanging fruit buys time. It does not guarantee long-term growth.
The real test is what happens after the reactivation phase.
Seat Pickups & Nonpartisan Wins
It would be unfair to pretend that nothing has improved. Pickups are pickups.
Since 2020, Democrats have consolidated dominance at the county level. County Council now stands effectively 10–1 Democratic, including the 2022 pickup of District 1, which flipped from Republican to Democrat. That is a measurable partisan gain.
At the municipal level, particularly in 2025 contests, Democratic-endorsed candidates defeated Republican-endorsed candidates in multiple documented races:
Rocky River Council Ward 3 & at-large council seat
Bay Village Council Ward 1
Those are real victories.
Cities like Bay Village, Rocky River, and Solon have moved decisively blue over the past several cycles. Organization matters. When local Democratic clubs are active, messaging improves. Sample ballots circulate. Turnout operations tighten. That infrastructure advantage shows up in results.
And it is also true that many of these seats are nonpartisan on the ballot.
That has two implications.
First, nonpartisan races can make it easier to win in suburban communities where overt party branding may still create friction. Voters often focus on personality, local issues, and familiarity. That dynamic can benefit organized parties operating behind the scenes.
Second, because these races are nonpartisan, some of the “flips” are not clean partisan conversions. They are endorsement-coded outcomes. A Democratic slate beats a Republican slate, but the ballot itself does not list party labels.
It is entirely possible that the nonpartisan structure itself contributes to Democratic gains in certain suburbs. Party organization helps mobilize, but the absence of party labels lowers ideological resistance in communities that have trended away from national politics.
In other words, not everything is captured in turnout percentages or reserve balances.
Institutional presence does produce seat gains. Democratic-endorsed candidates are winning municipal and county offices. The Council composition reflects that. Suburban councils reflect that.
But the question remains structural:
Are these gains the result of expanded voter engagement?
Or are they the product of improved internal organization within an already favorable electorate?
Winning seats is good. Consolidating dominance in suburban municipalities is good (for the party). Expanding representation on boards, councils, and local offices is good.
Low-hanging fruit strikes again.
The Salary Question
There is now a paid chair position. I think $80k/yr. That is a recurring expense.
That is not inherently wrong. The question is return on investment.
Is the spending producing:
• Higher turnout in Cleveland?
• Larger countywide margins?
• Expanded voter registration?
• Measurable fundraising growth?
The reserve data shows volatility, not sustained strengthening.
But reserves are not the full story.
Spending is.
Voter Turnout vs. Party Spending
Did The Money Move The Needle?
To answer that, I separated election types and compared turnout cycles.
Presidential Elections
2020 → 2024
2020 Turnout: 70.99%
2024 Turnout: 65.69%
Ballots Cast:
631,199 → 587,282
Change: –43,917 voters
Turnout Drop: –5.30 percentage points
During 2024, the party spent its highest recent cycle amount, approximately $421,000.
Turnout declined.
https://boe.cuyahogacounty.gov/elections/GetDocumentById/270ab3ab-3875-4d47-828b-a48567c2d2bd/
Midterm Elections
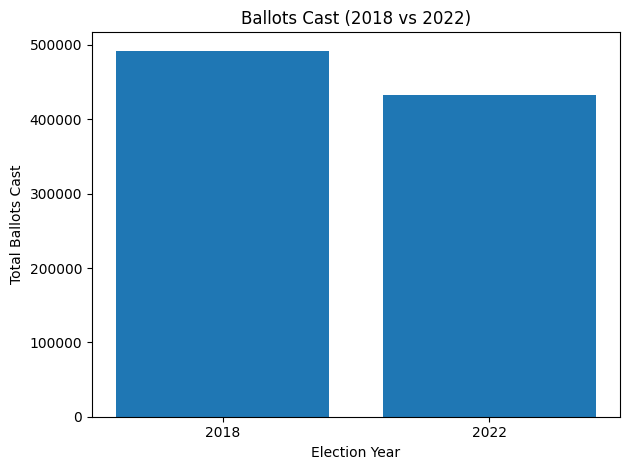
2018 → 2022
2018 Turnout: 54.52%
2022 Turnout: 49.29%
Ballots Cast:
492,323 → 433,007
Change: –59,316 voters
Turnout Drop: –5.23 percentage points
2022 was the financial high-water mark for reserves.
Turnout declined.
https://boe.cuyahogacounty.gov/elections/GetDocumentById/5d963393-8395-40ea-a932-b016d686569c/
Odd-Year General Elections
2019 → 2023 → 2025
2019 Turnout: 26.19%
2021 Turnout: 26.45%
2023 Turnout: 46.10%
2025 Turnout: 26.19%
The 2023 spike was dramatic.
Ballots Cast jumped by more than 170,000 compared to 2021.
But 2023 included:
• Abortion rights
• Marijuana legalization
• High-salience statewide issues
By 2025, turnout returned to baseline (~26%).
That spike was issue-driven. It was not sustained.
https://boe.cuyahogacounty.gov/elections/GetDocumentById/d4cc6ee4-6616-4660-ba47-9c0610351eea/
The Structural Pattern
Separate the cycles and the pattern becomes clear:
Presidential turnout declined.
Midterm turnout declined.
Odd-year baseline is flat.
Issue-driven years spike temporarily.
There is no sustained upward trend across any category.
The only meaningful increase occurred when ballot issues created salience.
Not when spending increased.
What This Means
Between 2022 and 2024, the party spent roughly $738,000 across cycles.
During that period:
• Presidential turnout fell by nearly 44,000 voters.
• Midterm turnout fell by nearly 59,000 voters.
• Only the issue-heavy year produced growth.
There is no macro-level evidence that increased spending produced sustained turnout expansion.
That does not mean spending had no value.
It may have:
• Stabilized decline.
• Helped targeted precincts.
• Improved organizational professionalism.
But at the aggregate level, turnout has not grown. Check out Cleveland turnout ward by ward from The Rooster

The Core Question
If turnout is the key to statewide relevance, then the metric cannot be:
“How much did we spend?”
It has to be:
“What did the spending produce?”
Right now, the data shows:
Volatile reserves.
Transfer-dependent rebounds.
Declining presidential and midterm turnout.
Issue-driven spikes that do not persist.
The early structural fixes were necessary.
But now we are beyond low-hanging fruit.
Now the question is whether the strategy evolves — or whether we remain reactive to election cycles and candidate transfers.
This was exhausting to research. Please consider becoming a paid subscriber.